Entrio OPtimize

Turn portfolio insights into action

Identify redundant technologies, evaluate consolidation opportunities, and model the impact of portfolio decisions with interactive optimization dashboards.
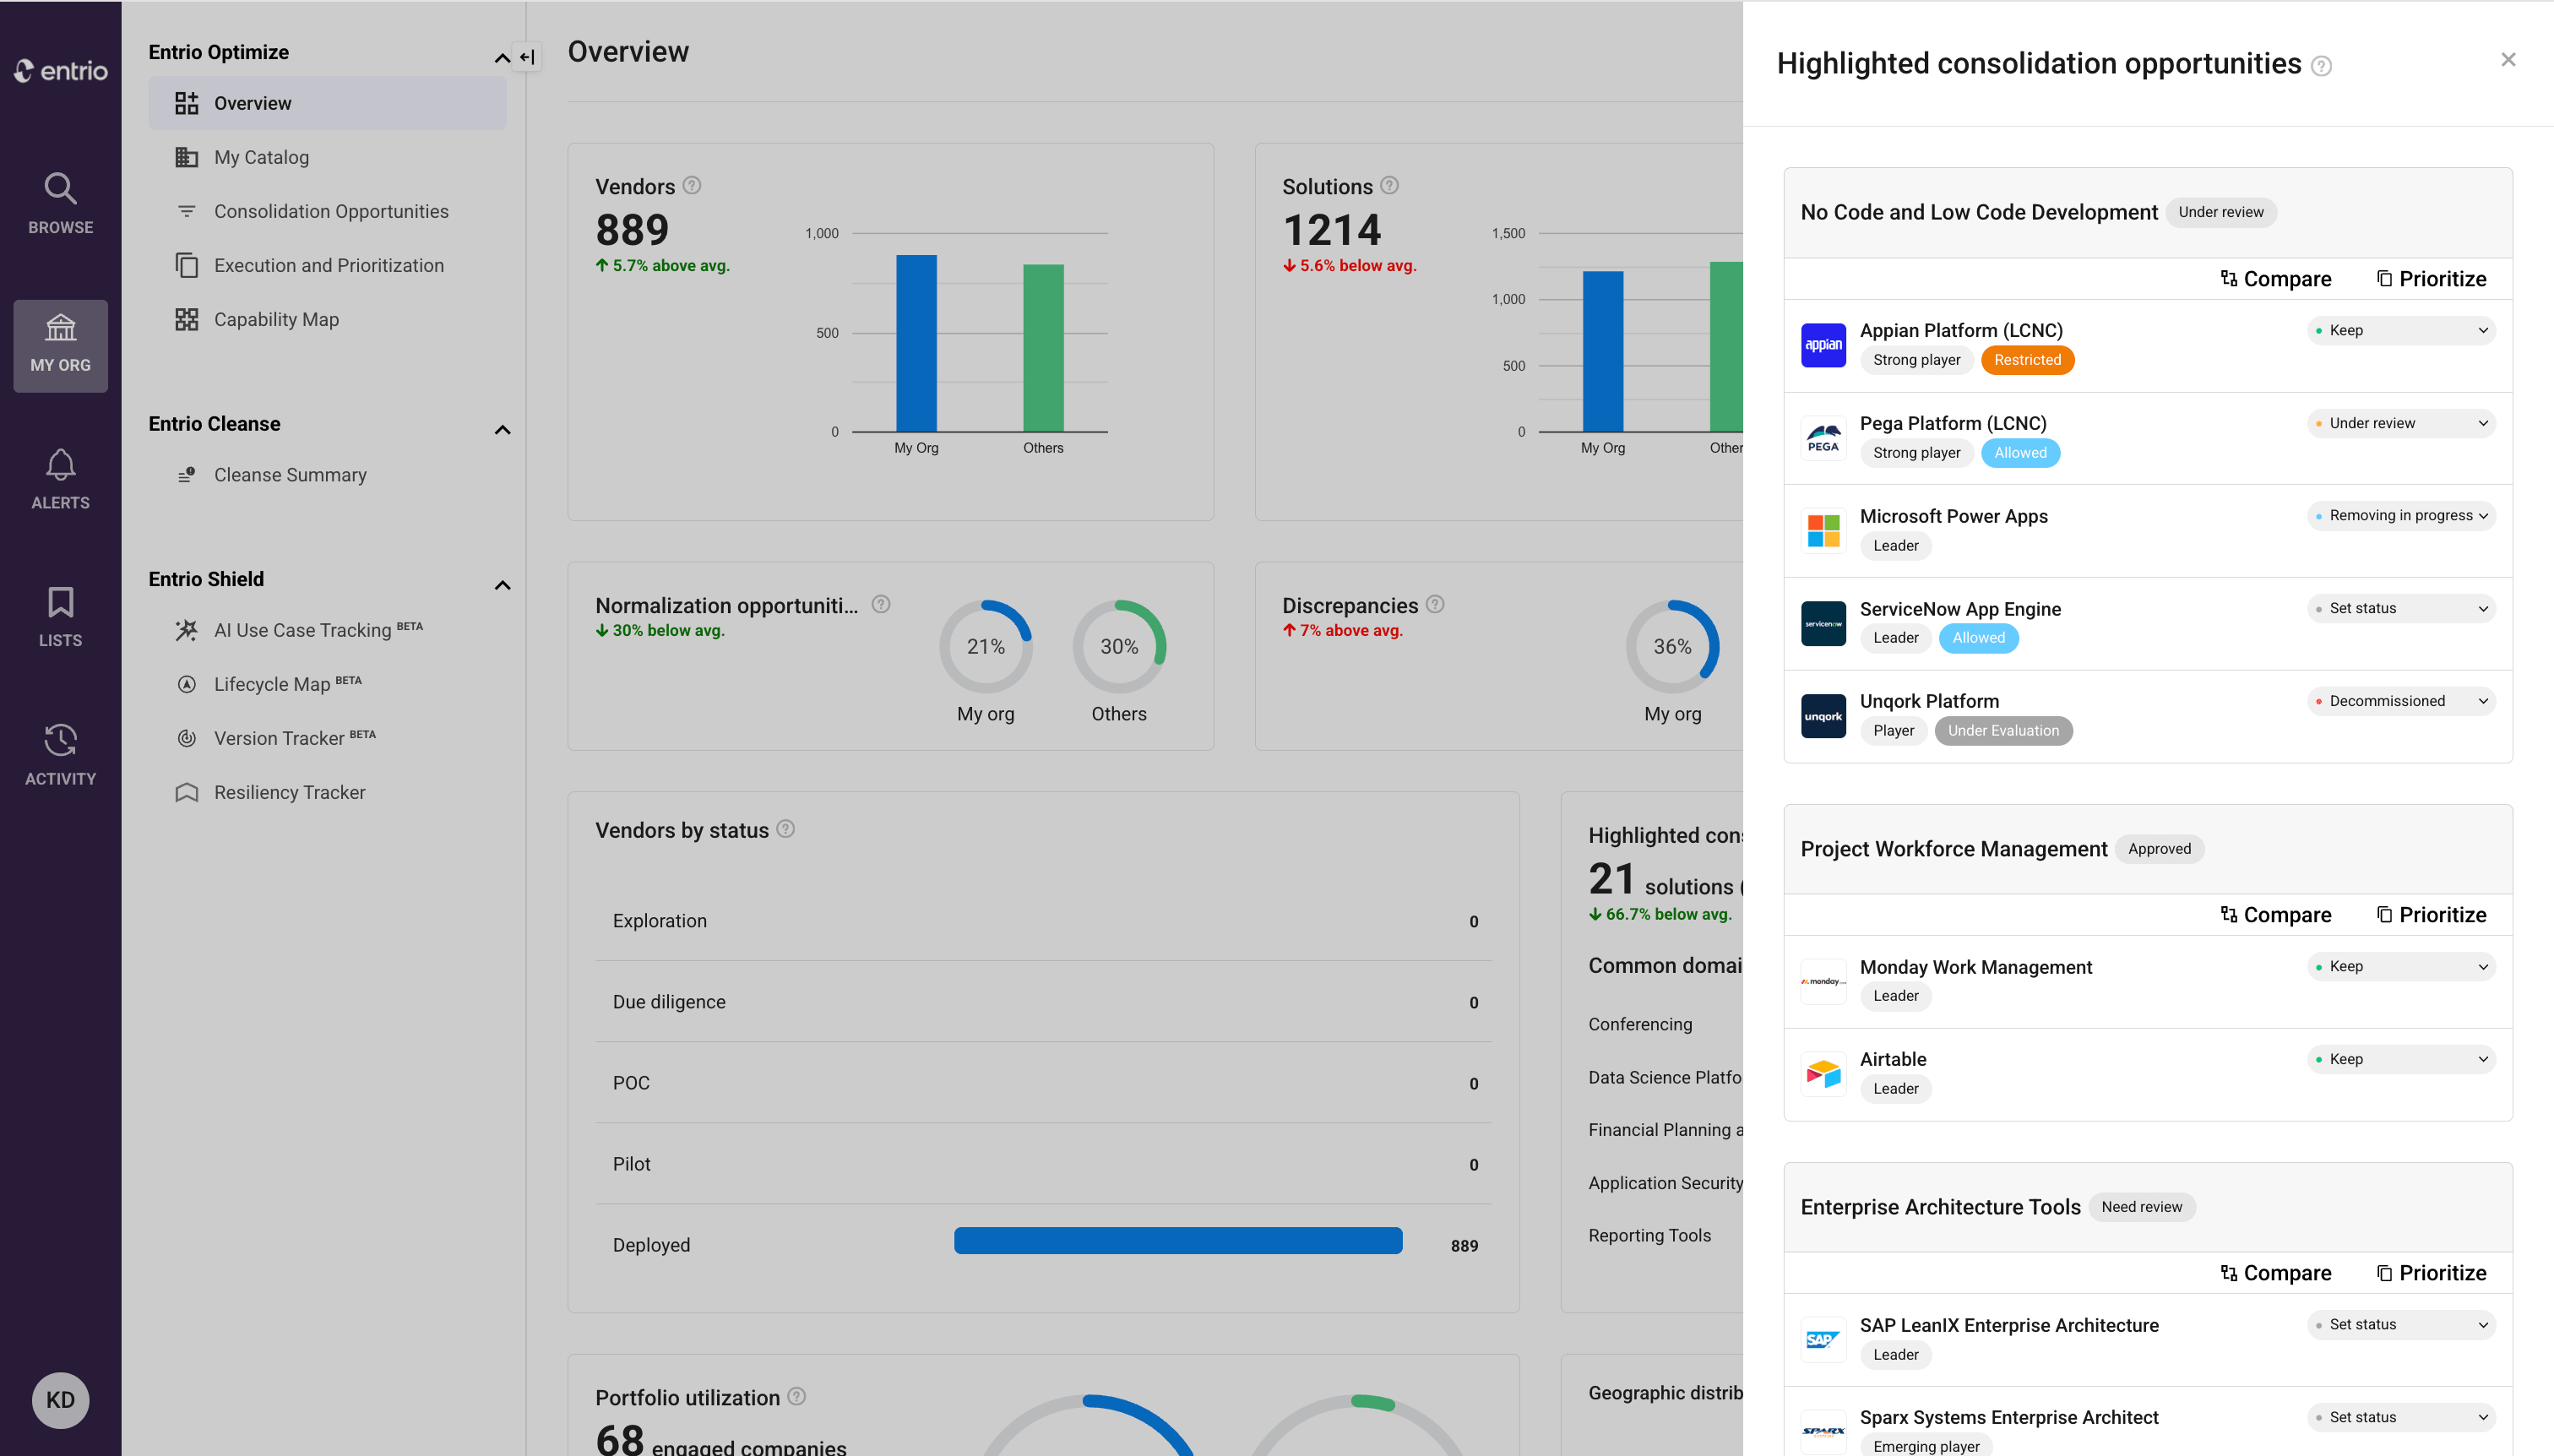
Dashboard showing vendor numbers, solution counts, status, and highlighted consolidation opportunities by category.
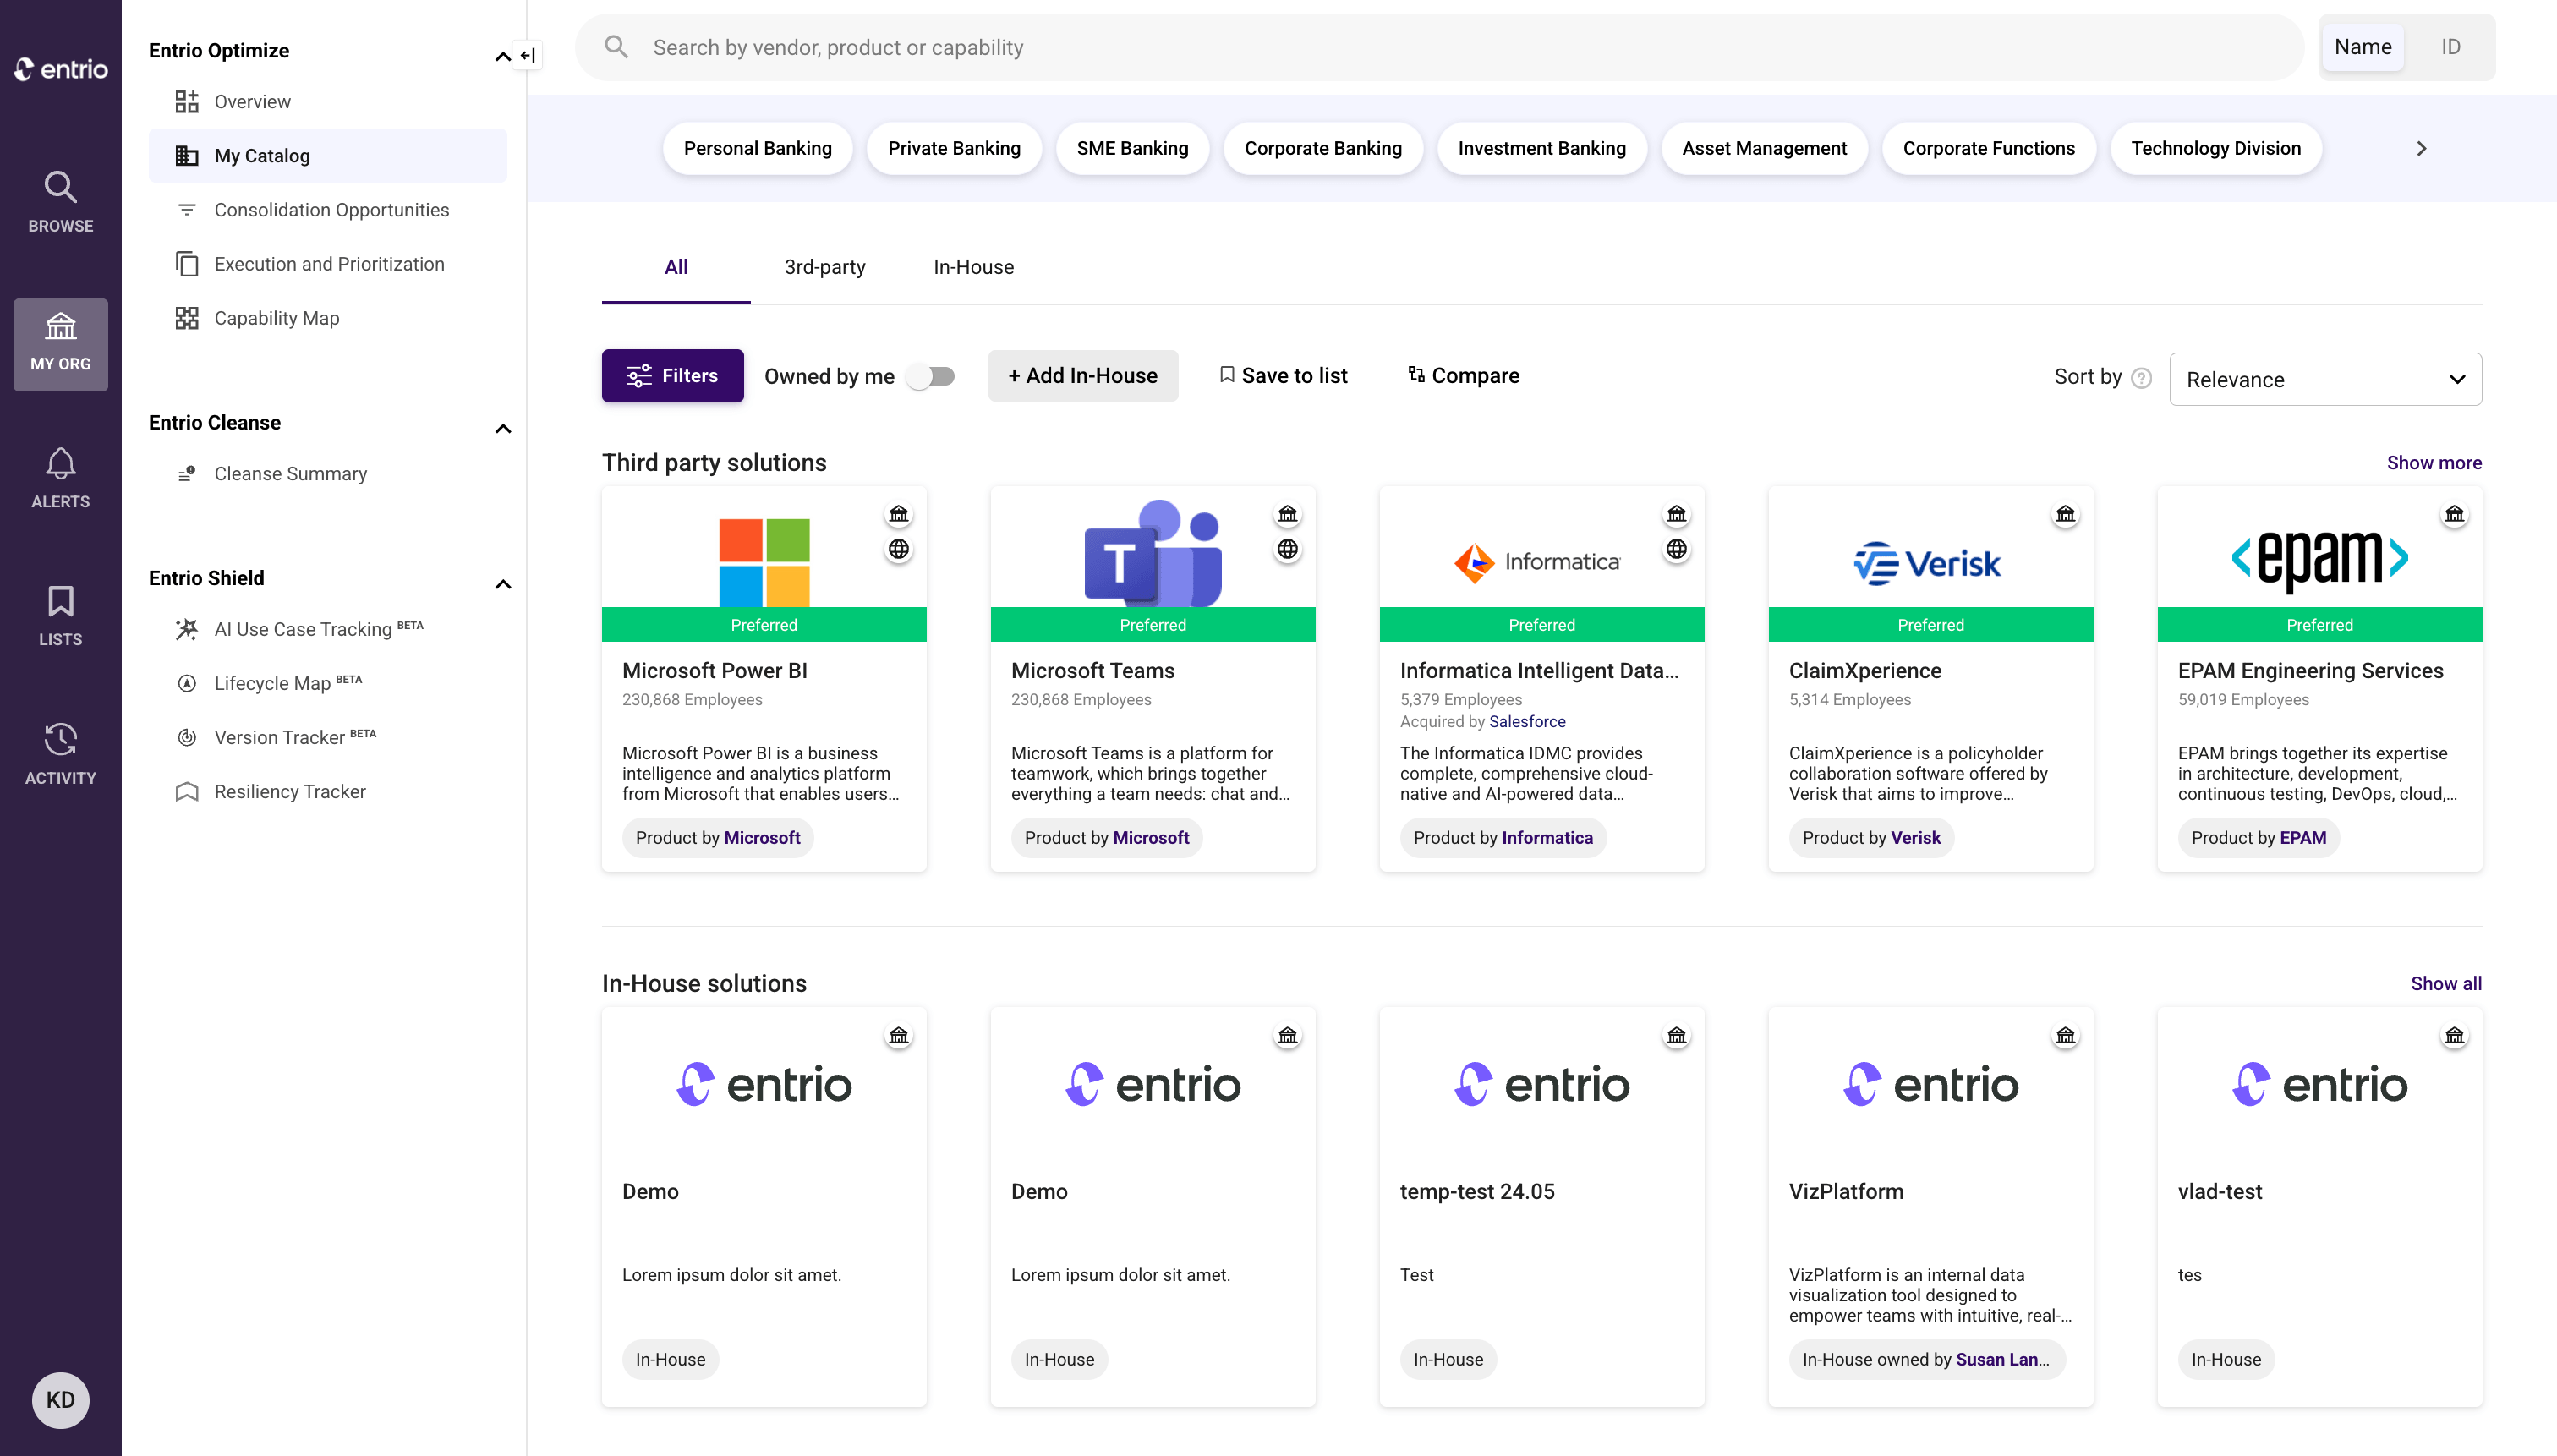
Entrio Optimize My Catalog page showing third-party and in-house software solutions with filter and search options.
Dashboard showing Microsoft Power BI product details, description, features, and engagement status with manager contact.
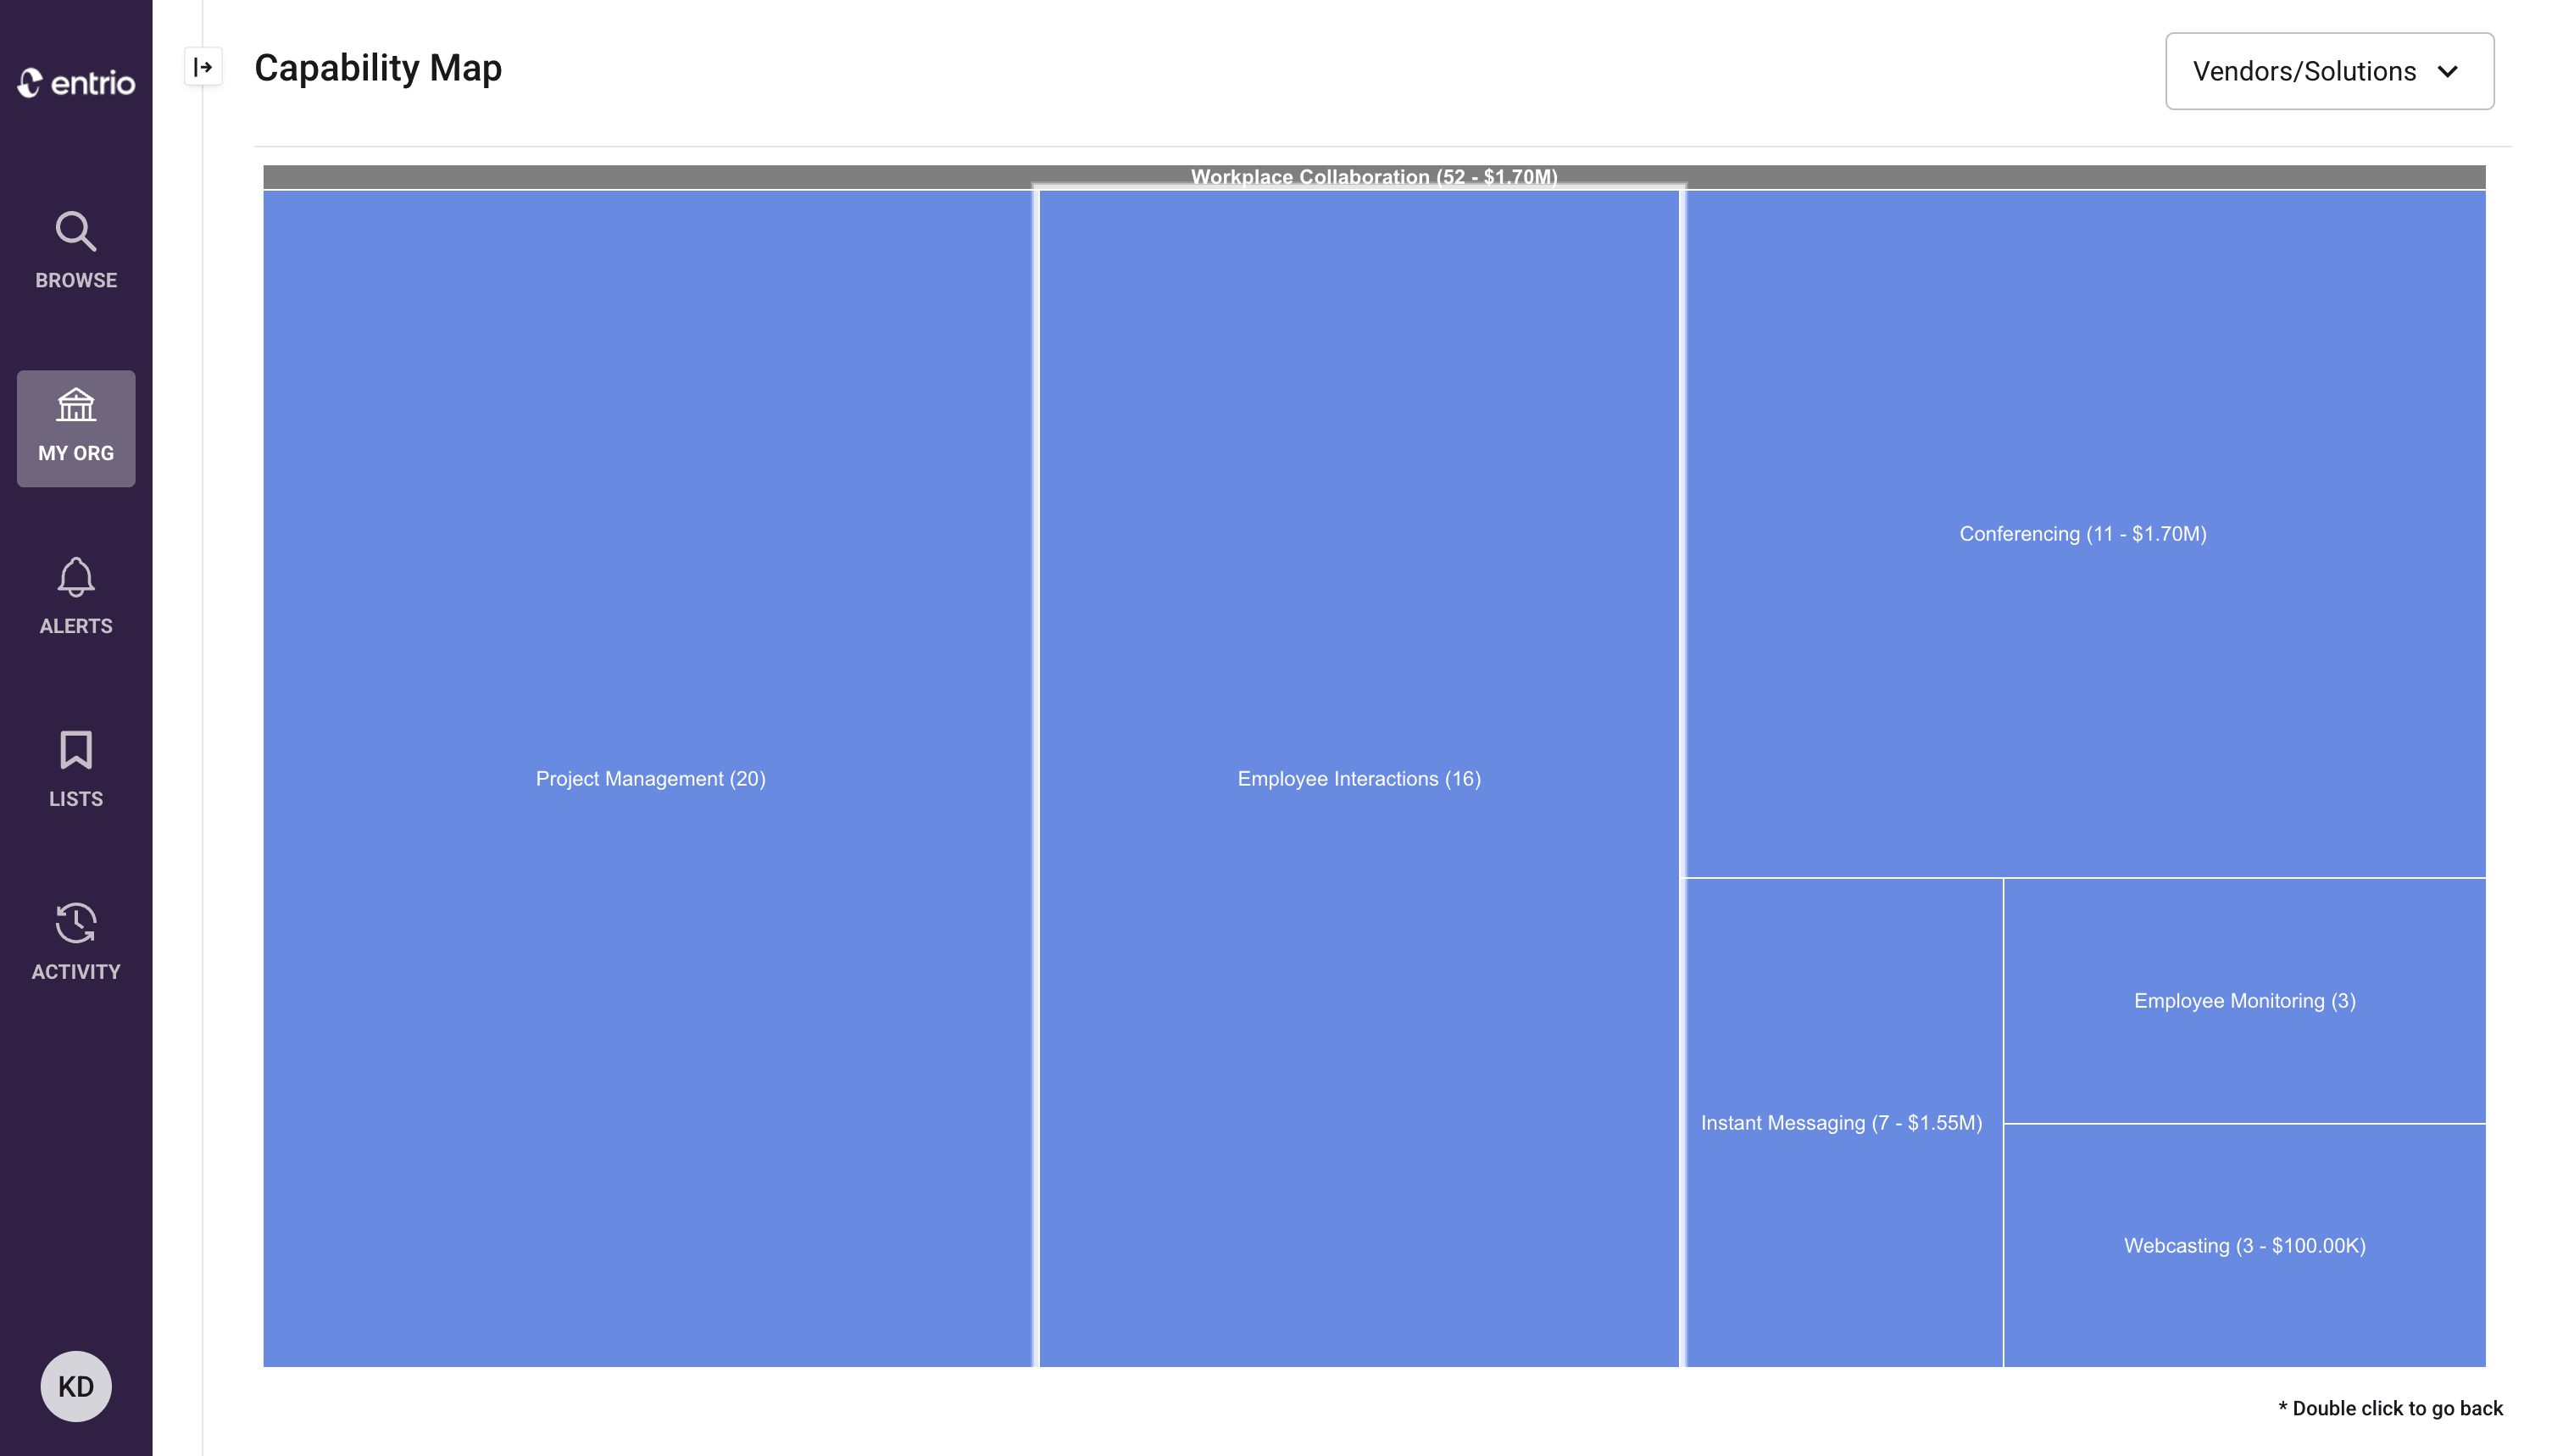
Capability map showing categories like Project Management, Employee Interactions, and Conferencing.
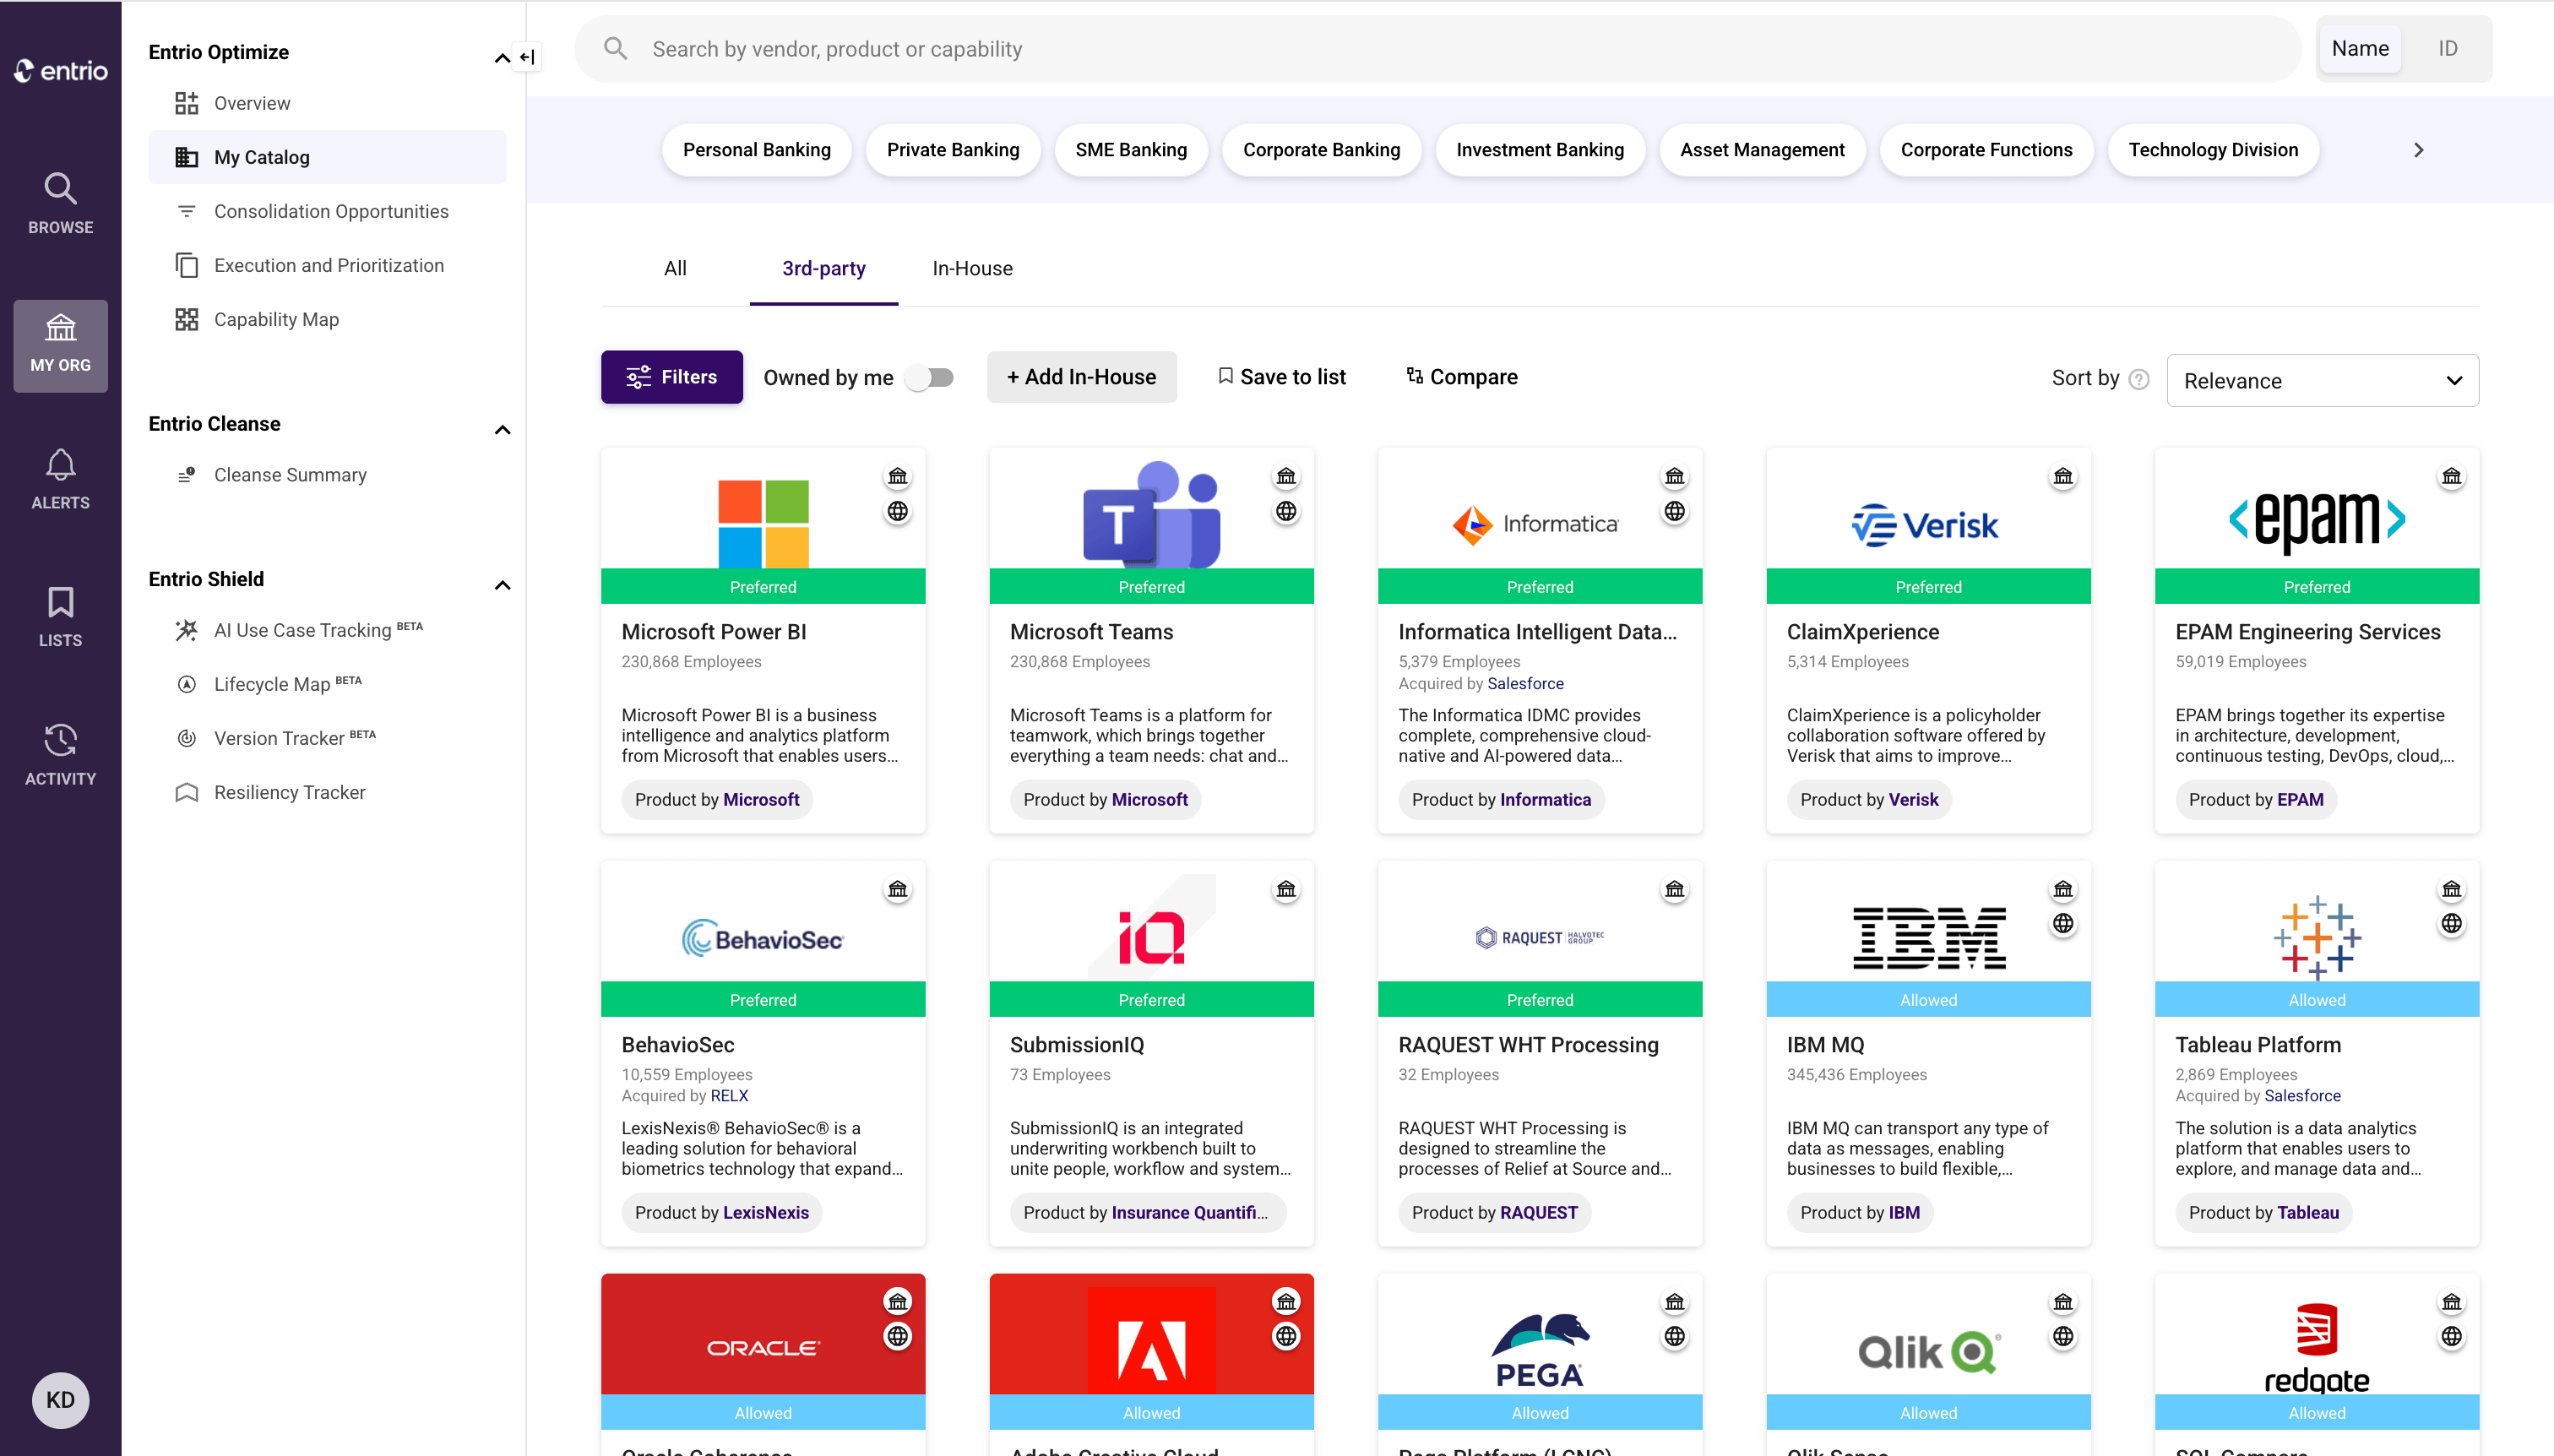
Dashboard showing 3rd-party software catalog with filters, product cards, and sorting options in Entrio Optimize.
Dashboard showing execution and prioritization of six solutions with status, spend, criticality, and contract dates.
Dashboard showing vendor numbers, solution counts, status, and highlighted consolidation opportunities by category.
Entrio Optimize My Catalog page showing third-party and in-house software solutions with filter and search options.
Dashboard showing Microsoft Power BI product details, description, features, and engagement status with manager contact.
Capability map showing categories like Project Management, Employee Interactions, and Conferencing.
Dashboard showing 3rd-party software catalog with filters, product cards, and sorting options in Entrio Optimize.
Dashboard showing execution and prioritization of six solutions with status, spend, criticality, and contract dates.
Reduce technology spend
Identify opportunities to consolidate overlapping applications and maximize the value of existing technology investments.
Standardize the technology portfolio
Promote preferred solutions and consistent technology standards across business units and teams.
Plan changes with confidence
Model portfolio decisions before taking action, using structured technology, contract, and spend data.

Optimize every technology decision

See where technology can be consolidated, standardized, or retired using interactive dashboards built for enterprise architecture teams.
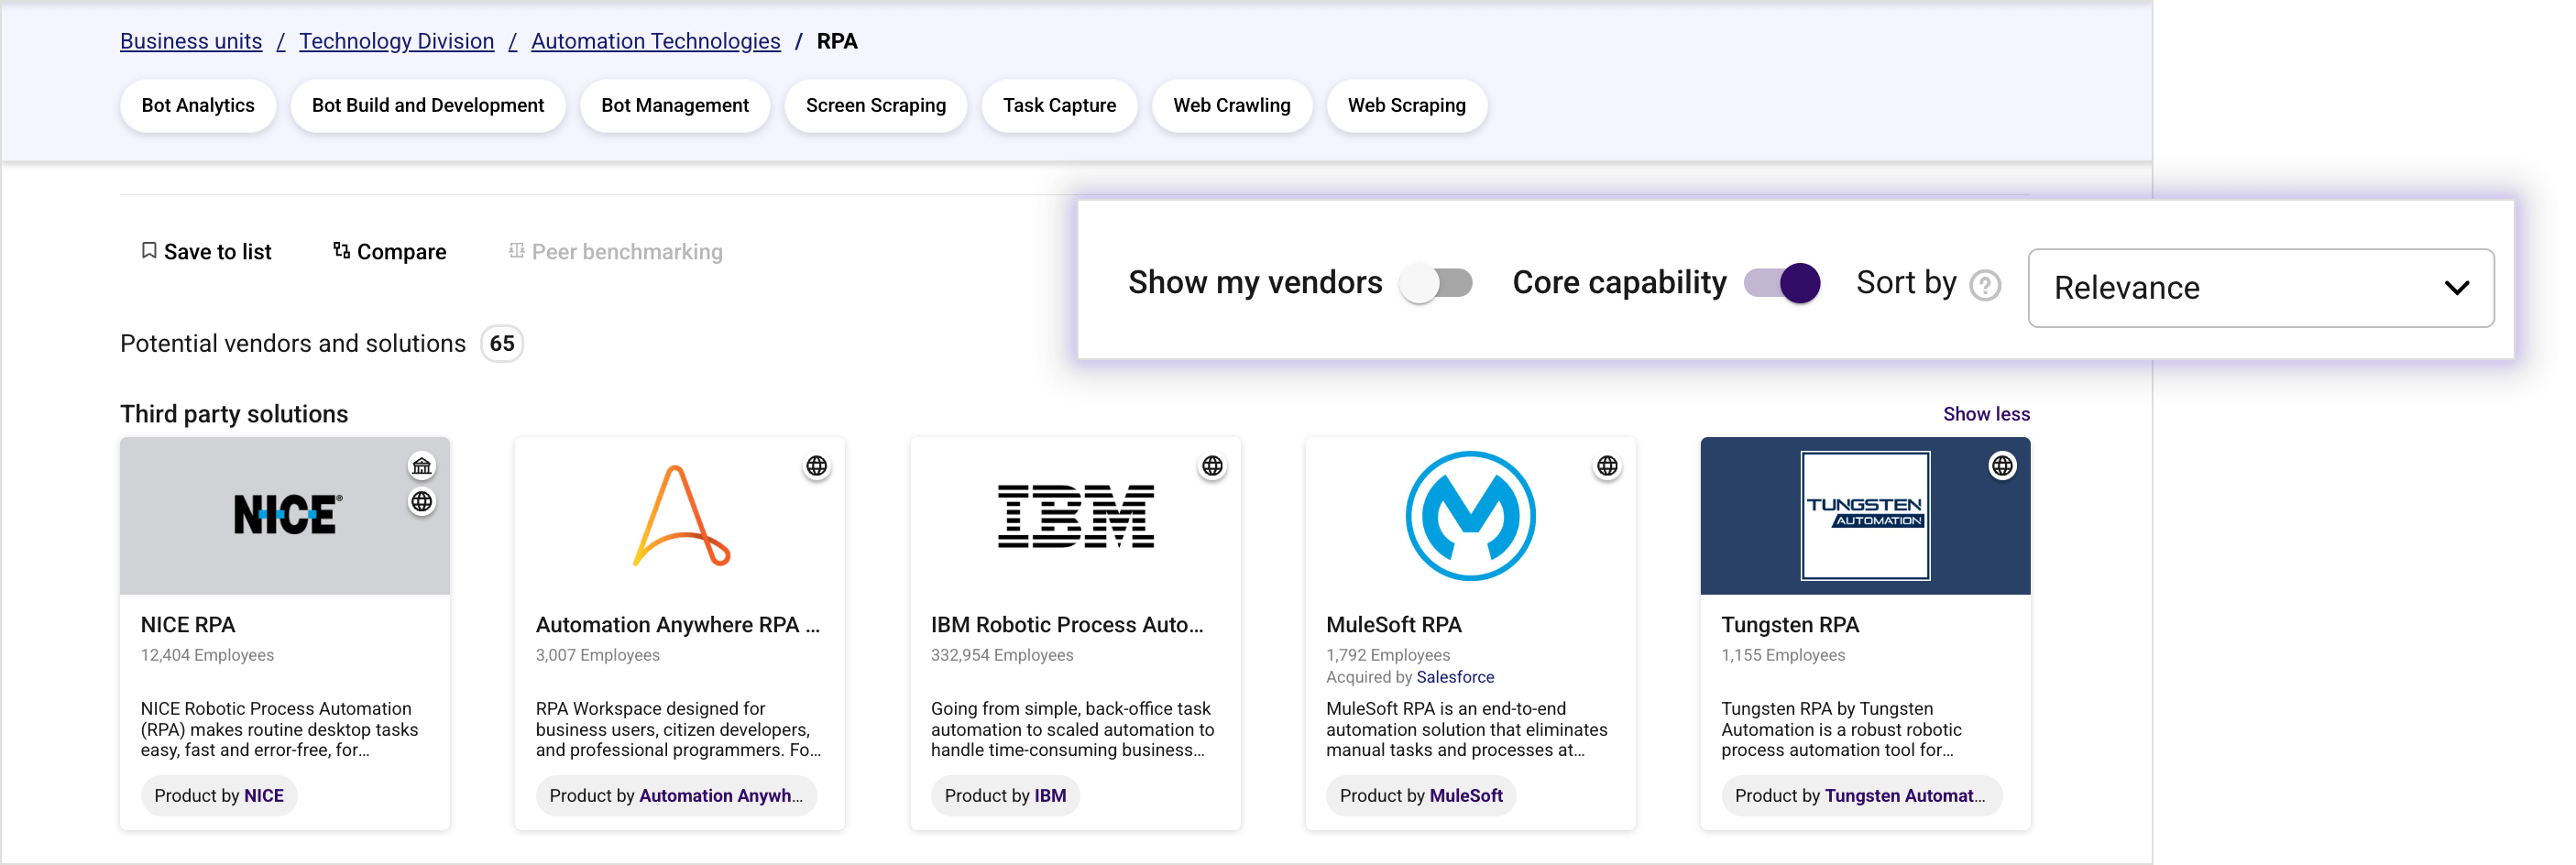
Understand core capabilities first

Every solution is mapped across its complete feature set while highlighting its one to five primary capabilities. Quickly understand what a technology is designed to do without losing the detail needed for deeper analysis.

Learn More
User interface showing a list of RPA third-party solutions with vendors NICE RPA, Automation Anywhere, IBM, MuleSoft, and Tungsten RPA, each with employee counts and brief descriptions.
Dashboard showing execution and prioritization of six solutions with status, spend, criticality, and contract dates.

Identify consolidation opportunities

Surface functionally overlapping technologies using capability-level analysis rather than broad software categories. Compare redundant applications side by side to determine which solutions are best suited for consolidation. Model decommission scenarios before making portfolio decisions.

Learn More

Analyze portfolio size & coverage

Explore your technology portfolio by business capability, domain, vendor, or application. Understand where technologies are concentrated, where investment is highest, and how solutions are distributed across the enterprise.

Learn More
Treemap showing data analysis categories like visualization, analytics tools, intelligence, reporting, querying, dashboards.

Promote technology reuse

Guide employees toward preferred and existing technologies instead of introducing new vendors. Strengthen architecture standards while reducing unnecessary software purchases.

Cards showing third-party solutions with status (Allowed, Restricted, Not Approved, Under Evaluation) and employee counts.
Man working on computer.

Streamline new technology requests

Standardized request data helps architecture, procurement, security, and risk teams evaluate requests faster and more consistently.

Learn More

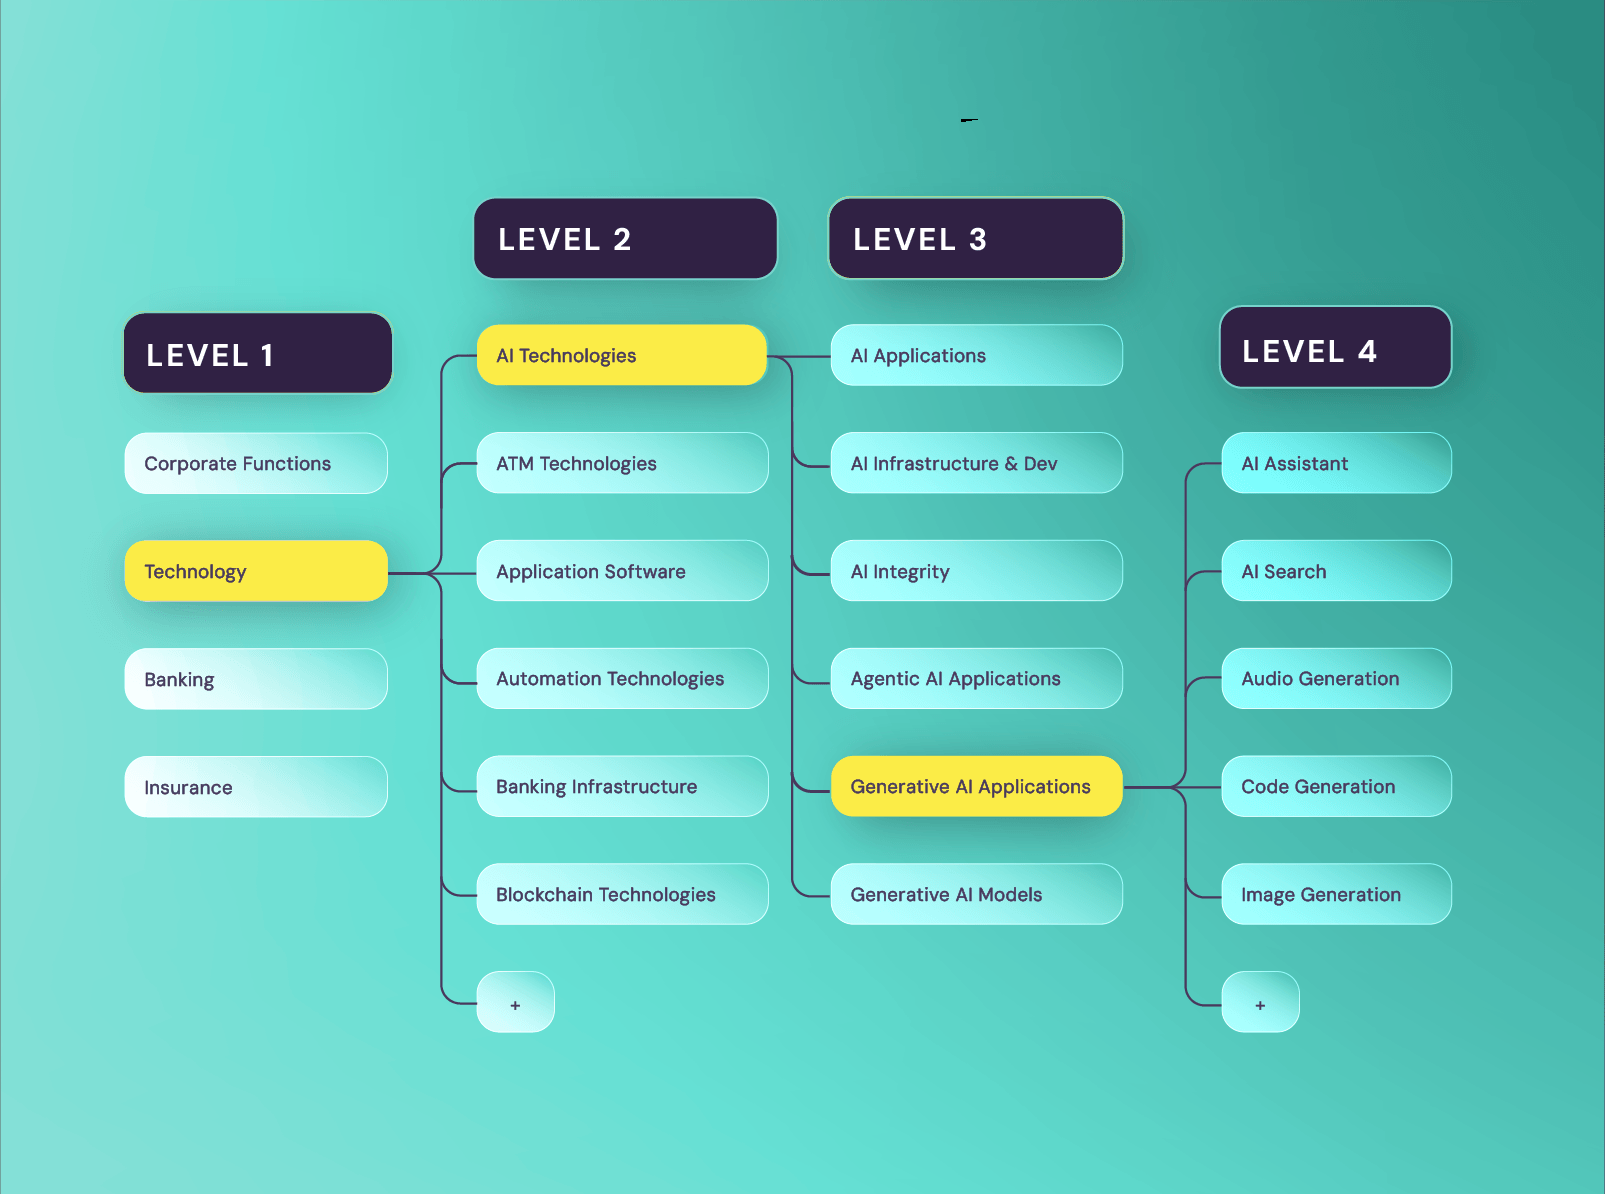
Powered by Entrio's dynamic taxonomy

Optimize uses Entrio's multi-level technology taxonomy to map every application to its core capabilities and features. By classifying technologies consistently, it uncovers functional overlap, identifies true consolidation opportunities, and provides a reliable foundation for portfolio optimization.
Learn more
Four-level taxonomy chart of technology and AI categories, from corporate functions to AI assistant features.

Optimize your portfolio with confidence

Turn technology intelligence into measurable cost savings and better portfolio decisions.